Heart Disease Risk
Posted on Thu 03 March 2016 in articles
Background
Who doesn't like heart disease? Aah-em --- let me rephrase that! Who likes not having heart disease? I did a project with a group of data scientists at Metis where I was elected the role of Product Manager for our data science product.
We created a product which would help individuals assess their risk because it is really frustrating not knowing typical numbers when doctors take measurements. What do those numbers mean? How do they work together to determine my risk? What is my risk if I have family history of heart disease but I take care of myself?
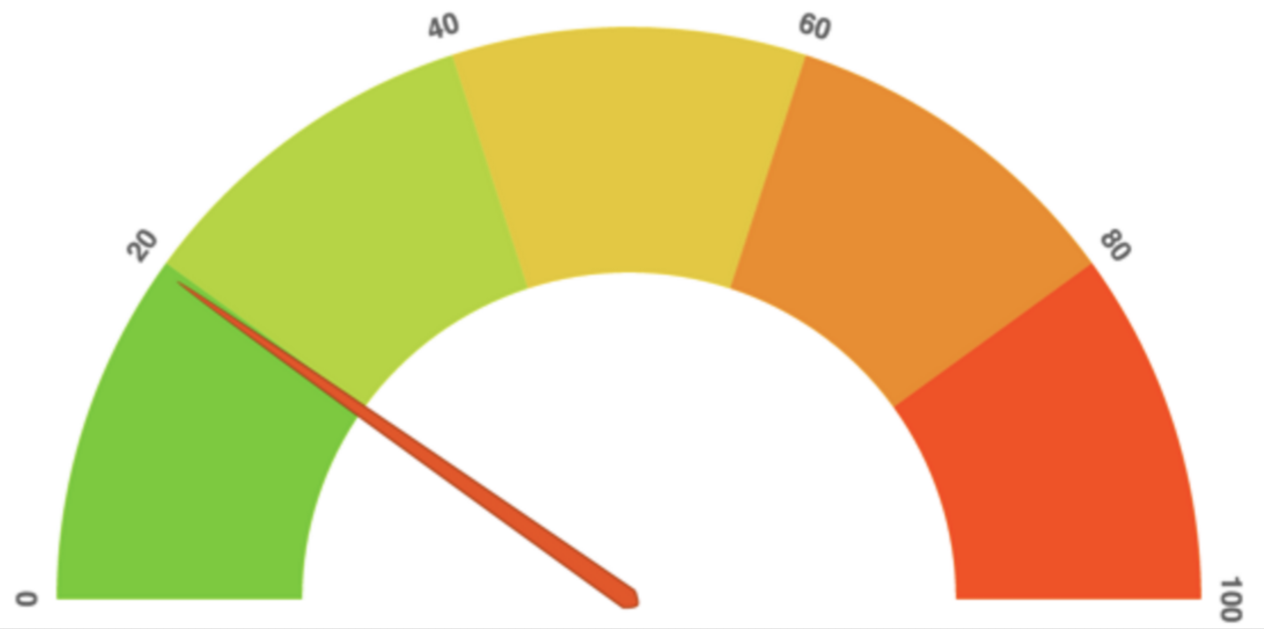
Our app makes your diagnostics interpretable! Given user input from our web app (created using Flask), users would receive an overall heart disease risk score from 0 to 100, visualized using D3.js. Below is a snippet of our custom gauge inspired by this.
Data
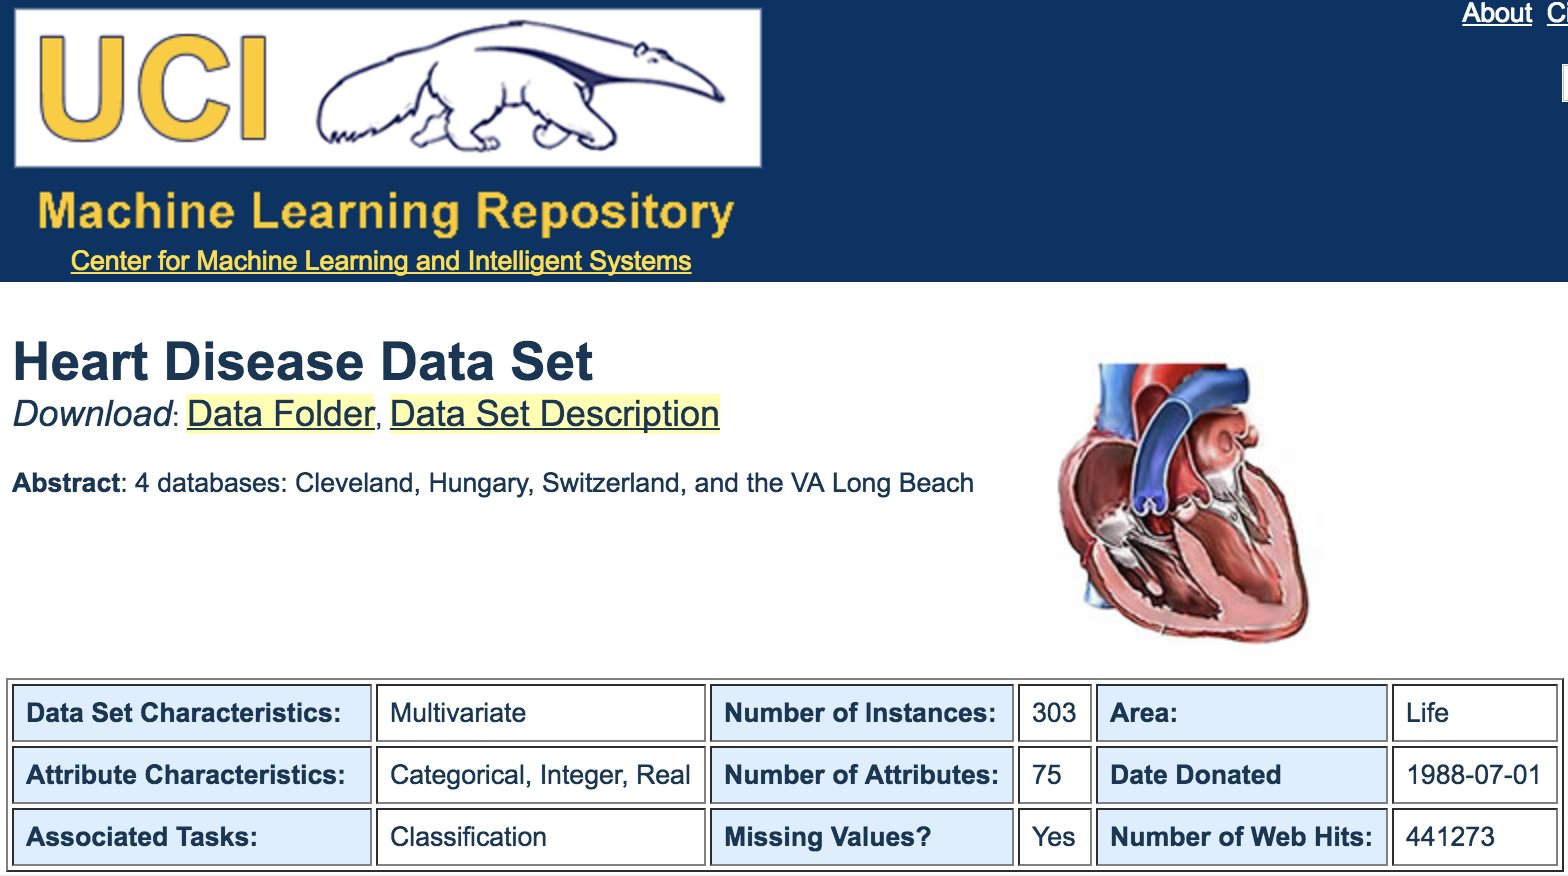
Data was used from the UCI Machine Learning Repository. There's been a lot of academic papers relating to this dataset, so it was accessible by downloading the .csv files and using python's pandas library for cleaning and exploration.
Most of the data had been processed and was (unrealistically!) clean. There were only a few values we needed to impute, so it wasn't long before we could get to exploring.
Our Product
It was important for us to consider the user before getting too ahead of ourselves. We envisioned the typical user as being away from the doctor's office, but very concerned about their health.
But how can we design our product to reflect the users health concerns without using more advanced measurements, typically perfomed by a doctor?

Our solution was to create some optionality within our input form on the web app we created using Flask. We wanted to create two models: a simple model with features everyone would know such as: Age, Sex, Family History, Smoking History, etc. and a more complex model which complemented the simple one by adding metrics that some people would know like Blood Pressure and Cholesterol.
Furthermore, we wanted to optimize our model towards recall. We wanted to ensure that people at risk for heart disease would be identified as such. We built a voting classifier that used GaussianNB, SVM, and logistic regression.
What I learned
I really liked this project and enjoyed being the Product Manager for our diverse group --- it was valuable having a 'birds eye view' of our work and help make decisions about the product around a strict timeline.
I learned to really value the importance of delegating tasks to meet our deadlines in time. Paradoxically, it was also important to collaborate on important decisions or specific challenges. Finding the right balance between the two is what made our team exceptional!